What is the Baker Hughes Rig Count Trying to Tell Us?

What is the Baker Hughes Rig Count Trying to Tell Us_

Those who cannot remember the past are condemned to repeat it.’ — George Santayana.

One of the questions dominating oil service company C-Suites and boardrooms this quarter has been debate about US drilling activity and where it will head next. Will LNG exports drive a recovery in the gas-drilling market? Will $50 oil be sustained? Will we see $20 before we see $200? How deep do we cut and for how long? While our crystal ball is as foggy as anyone’s in the industry, we do believe a glance back in the rearview mirror can help explain how we got here and provide some insight as to where we might go next.

A Look Back

The Baker Hughes rotary rig count has been an industry bellwether since 1945, and it remains one of the best indicators of capital spending today, 70 years later. Over the years it has become more detailed; adding information on the desired reservoir target, depth of the wells and technological sophistication (vertical, directional and horizontal). The rig count is being used today to estimate the number of wells drilled and with the rig count by basin it is being used to forecast production.

Mostly Conventional Drilling, 1987-1999

When Baker Hughes started publishing an oil and gas rig count 1987 we had 559 oil rigs, 337 gas rigs and 26 rigs that were either geothermal or tight holes. Within two years, the gas-directed rig count matched the oil-directed count. By the end of the 90s, some began to refer to the US “gas and oil” industry, rather than the “oil and gas” industry. The industry experimented with “tight gas,” encouraged by tax credits. Overall activity was dominated by drilling in conventional reservoirs. The total rig count averaged only 845 from July 1987 to July 1999, a total of 12 years. The “norm” during this period was a US rig count that has spent two-thirds of its time between 710 and 970 and rarely broke 1,000.

The Unconventional Gas Boom, 1998-2008

The first big play of the 21st century was unconventional gas. It began in 1998 in the Barnett in Texas. Activity quickly spread to the Fayetteville in Arkansas; the Haynesville in Louisiana and Texas; the Woodford in Oklahoma; the Marcellus in West Virginia and Pennsylvania, the Eagle Ford in Texas; and finally the Utica in Ohio, Pennsylvania and West Virginia. The boom in natural gas drilling peaked in August-September 2008 at 1,606 rigs.

The Unconventional Oil Boom, 2005-2014

Horizontal drilling and hydraulic fracturing techniques developed for unconventional gas began to be applied to unconventional oil plays starting with the Bakken in 2005. Again, the new techniques spread like wildfire and soon plays in the Eagle Ford, Bakken and Permian were delivering breakthrough oil production.

Chart 1: US Rig Counts, Oil-Directed, Gas-Directed and Total
(source: Baker Hughes, www.bakerhughes.com)

The Overlap, 2005-2008

Between 2005 and 2008 the industry benefitted from booms in both unconventional gas and unconventional oil drilling. The rig count rose from 1,243 at the beginning of 2005 to 2,031 at the peak of unconventional gas drilling — an average increase of over 17 rigs per month for 45 months

The Unconventional Gas Bust, 2008-present

Chart 2: US Gas-Directed Rig Count
and Gas Production

(source: Baker Hughes and EIA)

Production from the unconventional gas plays more than satisfied the US markets and in September 2008 market sentiment collapsed. The gas-directed rig count, shown in Chart 2, peaked at 1,606. Lower gas prices would not support dry gas development, and attention shifted to wetter plays where oil and natural gas liquids (NGLs) production could drive acceptable economic returns. Oil and gas companies pivoted, if they could, away from dry gas and towards oil and NGL plays. The gas-directed rig count fell precipitously. Despite a significantly lower gas-directed rig count, shale-gas production rose and has continued to rise since, despite a declining rig count. More efficient drilling techniques, an increase in the number of wells drilled per rig, attractive economic returns on wet gas (NGLs) wells, and more production per well have more than offset the production decline from the existing conventional well population.

More than six years later the natural gas rig count continues to fall, and natural gas production continues to increase driven by the shale gas plays.

The Unconventional Oil Bust, 2014-present

Chart 3. US Oil-Directed Rig Count
and Oil Production
(source: Baker Hughes and EIA)

Referring to Chart 3, note that an oil-directed rig count of around 200 allowed conventional oil production to decline from 6-Mbpd to 5-Mbpd. When the oil-directed rig count increased to 300-400 rigs, the industry found it was adding enough production to offset reservoir declines. (To be fair the changing mix of wells and efficiency improvement also contributed as well.) By 2010, drilling unconventional oil plays began to add significantly to production. Note that there was a 1-2 year lag between drilling activity and production coming online. The oil-directed rig count rose faster than the gas-directed rig count, and had risen reaching a peak of 1,609 in October 2014. From its peak in October 2014, the oil rig count fell precipitously (see Chart 1).

The similarity between the unconventional gas boom and bust and the unconventional oil boom (and bust?) are spooky. Both were driven by new technology plays that changed economics and resulted in significant increases in activity and, in time, record production levels. Coincidently, both peaked at about 1,600 rigs. Unable to absorb the extra gas, the US gas market saw gas-on-gas competition causing prices to decouple from oil and trade at the coal floor. The lower prices changed drilling economics, and the rig count fell. Six years later it continues to fall as total US production grows, now approaching 75 Bcfd.

In the case of oil, the incremental production from the US, driven by these unconventional oil plays, exceeded the worldwide growth in oil demand. That is; all of the incremental global demand growth was satisfied by incremental US shale production and OPEC found itself losing market share to US shale oil. By late 2014, this caught the eye of OPEC. Unwilling to continue to see the share loss continue, OPEC chose to protect share, abandoned its role of swing producer, and let oil prices fall. With oil trading at about half its value a quarter ago and OPEC unwilling to play the swing producer role, the US rig count is now in free-fall even as US oil production increases. We note the change in production mirrors the change in activity with a lag of 1-2 years suggesting that US oil production will continue to increase in 2015 unless oil prices fall further and impact production.

So What Next? 2015-2020 and Beyond

We see four fundamental drivers that will support US activity levels for the next several years.

First, we expect maintenance drilling will continue, establishing a base level of activity. The recent rig count history would suggest we might need no more than 300 gas-directed drilling rigs and no more than 500 oil-directed drilling rigs to maintain “flat” production.

Second, we do not believe natural gas will see a boom in activity in the next five years. It is unlikely that supply shortfalls will be the source of the next activity increase. Today the market is amply supplied. Sixteen years after the beginning of the unconventional gas boom, and about six years since the bust, gas production is still growing and approaching 75 Bcfd compared to just over 50 Bcfd sixteen years ago.

It is unlikely gas demand will be the source of a surprise. Most demand that can switch to gas has switched. New demands for natural gas could appear, however, most require significant investment and long lead times. The industry will see demand coming before it must begin drilling.

A year ago supplying LNG exports would have been a candidate to drive the next activity boom. However, lower oil prices have eliminated the attractive arbitrage with Asian gas. Potential North American exporters are having difficulty signing up Asian customers willing to commit to long-term guaranteed deliveries.

Without significantly increases in demand, significant exports or a supply shortfall we would expect gas-on-gas price competition to continue while the rig count remains “stagnant”. If we are wrong, it will most likely be because we have underestimated depletion or because higher oil prices reestablish the Asian LNG opportunity.

Third, we do not expect oil to drive another near term cycle. Although the parallels between charts 2 and 3 are only anecdotal, they give us a reason to pause. Oil production declined with a rig count of 200 to 300 and held flat with a rig count of 300 to 400. While the rig count dropped each week in 2015, US oil production continues to increase. The historic lag between the rig count and production suggests that increasing production will continue throughout much of 2015. We do not know if, in aggregate, the oil wells drilled in the Bakken, Eagle Ford and Permian will show the slow decline rates associated with unconventional gas. If they do, a back of the envelope calculation might suggest that we will require no more than 500 rigs to offset the production decline and maintain production of 9-Mbpd.

Unless OPEC’s low-cost producer, Saudi Arabia, chooses to resume the role of swing producer, the high-cost US shale production will play that role and will set global oil prices.

Again, unless decline curves disappoint or global demand grows much more than the forecasts of 1.0-1.2 Mbpd oil prices will remain low enough to discourage uneconomic shale oil production.

Last, while natural gas liquids (NGLs) are expected to remain an attractive and growing market, the market is not big enough to drive a broad-based recovery.

Forecasts Are Always Wrong, Including This One!

To be fair, we did not anticipate the unconventional gas boom in 1998 or the unconventional oil boom in 2005. Sadly, we did not anticipate the busts either. (In fact it is a little embarrassing that we, the industry, did not anticipate the unconventional oil bust after looking in the rear view mirror at the unconventional gas bust six years ago!) So, absent another amazing technology story, we believe the US needs to hunker down for an extended period with activity below 1,000 rigs. Is your forecast different? What do you see driving the next US oil or gas boom in the 21st century?

Perhaps more important, what is your strategy for the next leg of the business? Cutting staff and squeezing vendors won’t protect margins for long. Are you preparing to fundamentally change your business processes.

New Pages for an Old Playbook

New Pages for an Old Playbook — Driving Competitive Advantage

download as a pdf

Last Friday, January 30th, the Baker Hughes rig count continued its decline with an announcement that the oil-directed rig count fell the most in any single week since 1987. News headlines trumpet the continuing layoffs as companies execute the bust cycle playbook.

We all recognize that attempting to preserve margins solely by trimming variable cost is a no-win game. Cutting variable costs in proportion to activity decline does nothing to address reduced absorption of fixed overhead or compensate for reduced pricing. Cutting variable costs more aggressively than the activity decreases stresses the organization unnecessarily.

So, companies must take time to make processes more efficient by eliminating waste to trim fixed costs and preserve margins. Limited resources must focus on the processes with the most leverage. Strategically we want to pick the skirmishes that will win the battles and the battles that will win the war to build competitive advantage. So, where do we start?

In “This Time, Don’t Forget Your Stopwatch!” we suggest that executives concentrate on eliminating wasted time, as evidenced by idle inventory, to cut costs. The focus on time, rather than cost, yields benefits by improving lead time and process reliability and potentially making the company more competitive.

Create a Customer-Anchored Supply Chain

Another, more strategic approach, is to drive initiatives that will create share gains and protect or improve margins. Through a process of anchoring our goals in our customer, we can create a Customer-Anchored Supply Chain© that builds competitive advantage.

Identify Customer-Applications

To anchor in the customer, we must first listen to the voice of the customer. We cannot hear all the customer voices at once (see Bruce Almighty) so we start by focusing on a particular group of customers performing similar applications. The customers should share similar buying practices. Applications are similar to markets but do not include a geographic dimension. Examples of applications include un-conventional oil, conventional gas or heavy oil. We define a “customer-application” at the intersection of the two. A customer-application is a group of customers with similar buying behavior participating in application(s) with similar requirements. Examples might include “Majors in conventional gas” or “Independents in unconventional oil”.

Think Holistically

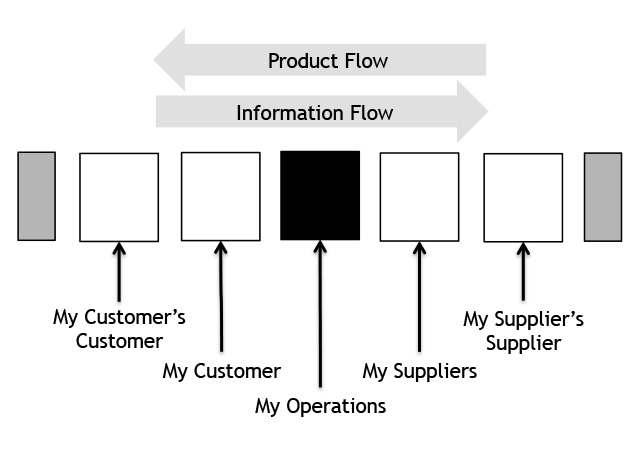
Think about the supply chain stretching from my supplier’s supplier to my customer’s customer.

Blog New Play1

Look beyond your direct customer to their customer (my customer’s customer) and ask what does my customer’s customer want? Answering this question aligns your organization with your customer’s organization. You will now share the same goal, which is to satisfy your customer’s customer. You should understand your customer’s customer’s needs so well that you should be as good as your direct customer at articulating those needs. Partner with your customer in these customer’s customer visits. Respect that maintaining the relationship with the customer is their day job.

Dig Deep, Beyond “Low Prices”

Every customer will say they want “lower prices”. The mantra is louder now in a down market. In reality, every customer, in every market, purchases the most perceived value for the least price. In our conversations, we want to dig deeper than “lower prices” to identify the critical success factors that the customer values. These factors tell us how to anchor in the customer. Improved performance on these critical success factors that the customer acknowledges, believes is repeatable, and values, leads to competitive advantage. Because we have carefully defined our customer-applications, we need to ask only a few customers to gain insight applicable to the entire customer-application.

Understanding Critical Success Factors

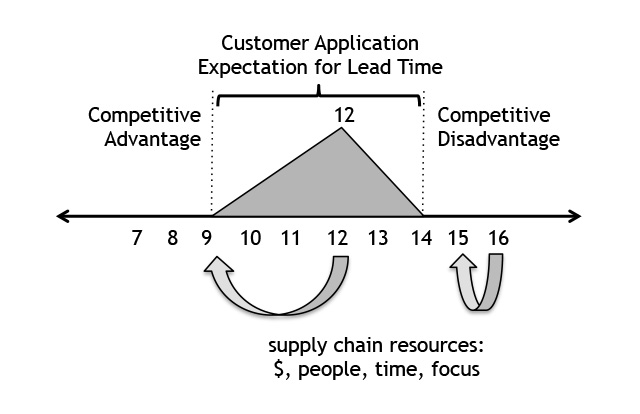
Learn how your customer values performance. For example, consider a hypothetical customer application and the critical success factor “lead time”. The customer’s expectation is not a single point – it is a range. On average, they expect 12 weeks but they fail to discriminate between suppliers offering 9 to 14 weeks. If the customer perceives your lead time is over 14 weeks, you are disadvantaged and must compensate with lower pricing or lose share. If the customer perceives your lead time is less than nine weeks, you are advantaged and can parlay that advantage into higher pricing or gain share.

Cast a Bold Vision!

Use what you now understand about your customers’ critical success factors and how they value performance, to cast a vision for performance improvement that is bold. Empower employees to develop initiatives to improve performance and realize the vision. Do not settle for marginal gains. In our example, improving performance from a “disadvantaged” 16-week lead time to a “disadvantaged” 15-week lead time, or from an “as expected” 12-week lead time to an “as expected” nine-week lead time will yield no benefit. We want breakthrough performance. To breakthrough, the customer must perceive the company as moving decisively from “disadvantaged” to “as expected” or “as expected” to “advantaged.”

Blog New Play 2

Choose Initiatives Strategically

Evaluate each initiative for the improvement in performance it will deliver on the critical success factors. Do not waste your time on changes that will improve performance only marginally. Do not waste resources on initiatives that do not build real competitive advantage. Support the teams that take on initiatives that have the potential to create competitive advantage by helping them overcome obstacles and manage the risk. Encourage the teams “playing it safe” and offering only marginal improvement to “get in the game!”

Closing the Loop – What the Customer Acknowledges, Believes, and Values Build Competitive Advantage

Improved performance on critical success factors that the customer acknowledges, believes is repeatable, and values, leads to competitive advantage. If the improvement is not measured, the customer cannot acknowledge it. If the improvement is not measured and sustained, the customer will not believe it. If the customer does not value the addition, they will not reward it. Measure your performance the way the customer does and sell the customer on your performance gains. The moral here is that no good deed will get rewarded unless the customer knows about it, believes it, and values it.

This Time, Don’t Forget Your Stopwatch!

download as a pdf

We Know the Drill

The drill is familiar. The Baker Hughes oil rig count peaked at 1609 in early October. It teased us by drifting only a percent or two lower heading into the holidays. Now, in late January, we find ourselves with a “four-handle” on the oil price. The oil-directed rig count is in free fall, down 18% from the peak and falling two to four percent a week. In just a few weeks, we have erased more than two years of growth, matching the rig count we had at the end of March 2012. Every seven or eight rigs lost from here turns the clock back another week. Stick around this industry long enough, and you will experience one of these cycles. Stay for 30 or more years, and you will be a veteran of many cycles.

The Bust Phase Play Book

For veterans of prior cycles, the pages in the play­book for the bust phase of the oil services business cycle are familiar. We forge answers to questions like: How long? How deep? Do we need temporary fixes or do we need to make structural changes? We struggle to get ahead of the curve. We worry. Did we to cut too deep? Did we cut deep enough?

Cutting Just Variable Cost to Preserve Margins is a No-Win Game

Preserving margins requires that we cut variable costs deeper to compensate for weak pricing and the difficulty of reducing “fixed” costs. Unless we address the fixed cost structure, margins cannot be preserved by cutting variable cost alone. Activity falls away, but the organization stays busy keeping up with the business we still have. Keeping employees motivated and focused is a priority as we try to restructure on a deadline. It is hard to be creative on a deadline. Eyes roll when we bring up yet another initiative. However, we must address the underlying processes. So where do we start?

Start With Inventory

Inventory is waste. Inventory is waste we cannot afford. Carrying inventory is expensive. A company must invest capital in it. Capital has a cost, based on the debt and equity markets, and shareholders expect a return on their investment. It must be warehoused. It must be counted. It is subject to shrinkage. It can become obsolete. Many of the costs of carrying inventory are hidden but, more important, inventory hides many costs.

As you walk around the shop floor, train your eyes to see all inventory that is not in motion or being worked on as waste. When you see idle inventory, challenge your team to identify the purpose of the inventory and what could be done to eliminate the need for it. Ask: “What would happen if we did not allow that inventory to be carried?”

Inventory does not solve problems it hides them. Inventory hides inefficient processes. Inventory hides processes that do not produce reliable results. Find the process the inventory is hiding and work on making the process more efficient and more reliable to reduce both costs and the need to carry inventory.

Do not rely on inventory reduction strategies that force vendors to invest in your unwanted inventory. Inventory reduction without process improvement moves the problem to someone else and does not improve overall economic performance. In time, the cost of carrying inventory will eventually be passed on to the company by the vendor.

Why Inventory Now?

The best time to have addressed how much inventory we are carrying was yesterday and unless your name is H.G. Wells that page is not in your playbook. The worst time is tomorrow because it never comes, so tear that page out of the playbook. That leaves us with now. Leverage the current weak business environment as a burning platform.

Reduce inventory by targeting the poorly performing process it is hiding. Look for idle inventory. If you are listening, idle inventory screams that there is a broken process. Making these processes more efficient now protects margins and builds competitive advantage that supports prices.

Measure Inventory with a Stopwatch

The most important tool for controlling inventory may be a stopwatch, and the best unit of measure may be days and hours rather than dollars.

The table summarizes many of the reasons a company carries inventory and the reduction strategy associated with each reason. Each reduction strategy depends on managing time better to manage inventory better. We manage time by making processes more efficient. When a company improves processes to reduce the time that inventory is idle (when value is not being added) inventory investment will be reduced, and costs will be cut. Supply chain executives need to develop a keen eye for spotting inventory and being relentless in pursuing idle inventory as wasted investment and fixing the process that the inventory is hiding. Remember, inventory reduction is about managing time!

Table: Reasons for Carrying Inventory

Reason for Inventory Inventory Reduction Strategy
Lot Size Reduce ordering cost or set-up cost
Demand During Lead Time Reduce lead time
Safety Stock Improve the reliability of stated lead timesReduce average leadtimeImprove forecast accuracy
Work-in-Process Reduce interoperation queue timesReduce set-up times
Staging Reduce process timesImprove process reliability of manufacturing and procurement
Transportation Reduce transportation timesImprove reliability

 What Do I Do Next?

  • Identify processes for improvement. Inventory investment in idle inventory is the telltale sign that a process is broken and has been hidden, same the way oil on the garage floor tells you to look for an oil leak.
  • Convert the dollar measurement into a time measurement. If staged inventory totals $250,000 and the firm ships $100,000 per week, you have a two and a half week opportunity.
  • Set an audacious goal. Can the two and a half weeks be cut to two days? Could two days be cut to half a day?
  • Empower a team, break out the lean tool kit, and value stream map the process. What are we doing and why? Is there a better way to do it?
  • Identify non-value adding steps and eliminate them. Make the value adding steps more efficient. Then do it again.
  • Implement with urgency. Redeploy excess assets or people to value adding processes or release them.
  • Monitor and repeat with a more aggressive goal.
  • Last, treat performance gains as treasures, not to be squandered when activity picks back up as it inevitably will. React quickly to preserve lead time gains, communicate them to your customer, and build competitive advantage!